The Year Ahead in Economics

The Big Picture:
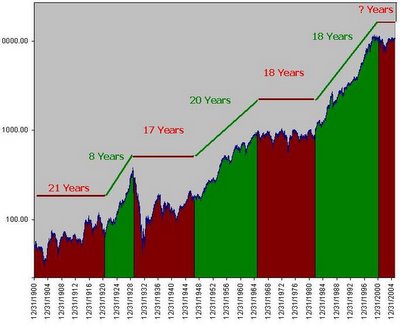
Is it possible that an 18 year Bull market could be followed by a 3 year Bear, and then launch into another multi decade Bull? Sure, anything is possible. But as the chart below shows, it would be historically unprecedented.
One other thing worth noting: The steepness of the gains from 1924-1929 are very much parallel to the 1996-2000 moonshot. Both ended with near 80% drops (Dow for 1929, Nasdaq for 2000).
It took 25 years -- until 1954 -- for the Dow to regain its 1929 highs. I don't believe it will necessarily take that long for Nasdaq -- but I am aware of the outside possibility.
If you invest in the stock market, take note. There will likely be brief bull markets, but the "buy and hold" philosophy may be problematic right now.
Also, on the economic front, it should be noted that the bond yield curve officially inverted this week. I'm not going to take the space here to try an explain the technicals of this phenomena. Go here and read if you're really interested. To explain the meaning, I'll simply put this quote up from SmartMoney.com:
Inverted yield curves are rare. Never ignore them. They are always followed by economic slowdown — or outright recession — as well as lower interest rates across the board.It's only slightly inverted and only for a short time so far. The longer and deeper the inversion, the more significant.....definately something to watch.
0 Comments:
Post a Comment
<< Home