Secular Bulls and Bears
As a follow-up to the 100 year chart of the Dow, Barry at the Big Picture has provided us with a nifty little chart showing what a "flat" period looks like up close (click to enlarge):
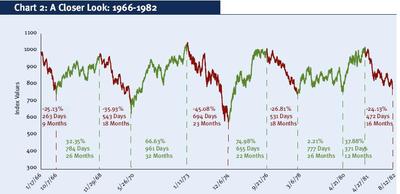
He puts us today at an equivalent to right around 1972. I totally agree with his assessment and think the market will be down next year. Like I said in the previous post, this may not be a good time to "buy and hold" stocks long term.
posted by greyhair @ 11:41 AM
2 comments
![]()
![]()
2 Comments:
I gotta say, I invest for a significant part of my living and that's pretty interesting.
Mike
This analysis agrees with what Bob Brinker says as well....
Post a Comment
<< Home