The Small Picture
Via The Big Picture:
For nimble traders only: The last time the New York Stock Exchange short interest ratio broke below a key trendline, the U.S. equity market had a short and sharp selloff -- one that was later followed by a major upside blow-off
The gray area on the chart is SPX; Blue line is NYSE short interest:
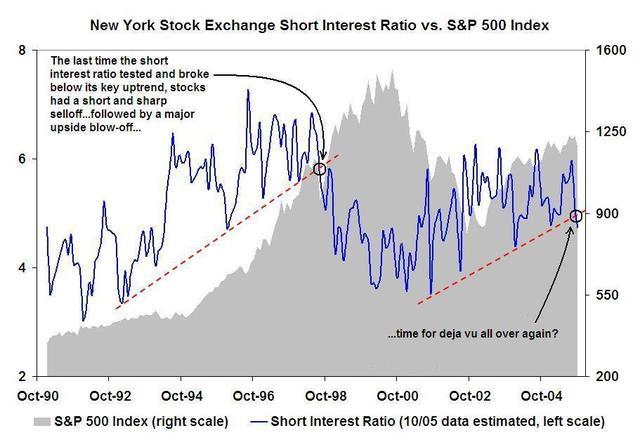
In normal language. Short interest is the amount of money betting that stocks will go down. It's a contrarian indicator. When there's not much short interest (meaning a lot of market optimism) it can presage a fall in the market, and vice versa.
What Barry is saying is that the last time the shorts broke an up trendline of this type, the market tanked and was then followed by a large rally. The tanking is news. The rally is conventional wisdom.
As they say, we shall see!
posted by greyhair @ 11:32 AM
0 comments
![]()
![]()
0 Comments:
Post a Comment
<< Home